NLP People job statistics: one year after the launch
Thanks to the Internet, the world has become a huge mountain of data convertible into insightful knowledge for decision making and conclusion drawing. We are living in interesting time: the amount of available information is growing exponentially, so do the methods used to process the data but, probably, at a slower pace. Industrial users have discovered an ocean opened opportunities to improve the performance of their businesses. A lot of questions that were previously answered based on expert judgment now are having analytically motivated answers.
It is not easy to believe, but the NLP People project has been online for more than a year already. We have accumulated the large amount of job-related information in the four industrial sectors we dealing with. In this publication, which is the first part of the annual report, we are sharing the results of the data analysis with you. Our primary goal is to extract insights that can be helpful in finding answers to strategic questions relevant for both active job seekers and general public interested in the IT research job markets.
We asked Andrey Ziyatdinov, a full-time researcher at Hospital de Sant Pau (Barcelona), to help us with data analysis. In particular, his task was to harness the data extracted from the NLPPeople.com internal database, visualize the job advertisement data and help job seekers find answers to the following questions:
– What are the countries with the highest number of IT consulting jobs? Which regions and countries are potentially more attractive for job seekers?
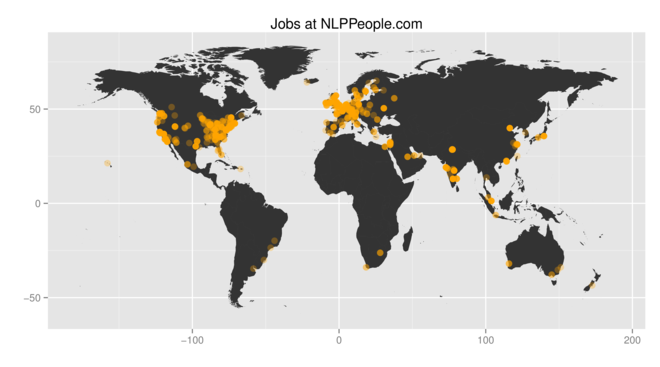
The IT research job market is becoming an increasingly international marketplace. The USA is by far the most attractive direction for the job seekers, followed by Europe and India. However, one always has a chance to find a job with NLPPeople.com in less common places like Iceland, Argentina or the South Africa.

Intensity of color correlates with the amount of available job openings.
| Region | Number of postings | Proportion | |
|---|---|---|---|
| 1 | US | 912 | 51.1% |
| 2 | Europe | 555 | 31.1% |
| 3 | Rest | 319 | 17.9% |

Time analysis shows that European and US markets show relatively strong correlation with each other. The curious spike in October 2012 is explained by that we started using US job ads aggregators (such as indeed.com and simplyhired.com) that entailed serious splash of new jobs we detected in the US industrial job market.
Drilling down to the country level, the distribution of job offers does not change much moving from one industry to another. The modern interconnected business world tends to concentrate in the traditional IT spots, like USA and Europe, and top outsourcing countries.

Intensity of color correlates with the amount of available job openings.
In many cases, recent graduates face a problem either to start entering the industrial job market or to proceed with the academic career. As we described in our previous publication, there is no short answer to the question of prioritization of the factors influencing this decision.
However, we can give some insights to help answering the following question:
– How do academic and industrial jobs distribute between Europe, USA and the rest of the world?

| Type | Number of postings | Proportion | |
|---|---|---|---|
| 1 | Academia | 223 | 12.5% |
| 2 | Industry | 1563 | 87.5% |
The most of the postings are related to industry (87.5%), while the resting 12.5 % of the job ads are academic. Governmental research centers belong to the latter category as well.

It’s known that the increase of multlinguality is one of the key strategic goals for Europe. It is easy to see that the amount of academic jobs in Europe is higher than in the USA since the language technologies have been received significant support over the last few years from the European Commission.
At the same time, industrial American market is much more attractive than the European one. Due to a high number of start-ups, SMEs and corporates heaving headquarters and offices in the US.
– How does this distribution change if only big market players are considered?
The geographic distribution of most popular job locations remains practically unchanged if only “big” companies (employers that advertises more than 15 jobs at our website) are considered.

Intensity of color correlates with the amount of available job openings.
As expected, the list of “big” companies that posted the highest number of job ads in the NLP area includes the names of IT giants (Microsoft, IBM and Google) and relatively large companies operating on the NLP market (Nuance, Lionbridge and Appen Butler Hill).

To conclude the first part of the annual report, we provide you with some statistics of the job ads advertised at NLP People after one year (by April 2013).
First, we consider the number of job ads published at NLP People monthly. The total number of vacancies accumulated during the first year of the website operation is 1,786 that makes almost 5 new job openings published per day.

The figure shows several time stamps in the first year of the NLP People’s operation:
- July 2012 – the crucial growth of job ads started.
- October 2012 – the highest number of postings over the observation time.
- December 2012 – the minimum number of jobs, possibly due to the Christmas holidays.
Statistics per category is shown below:

| Category | Number of postings | Proportion | |
|---|---|---|---|
| 1 | NLP | 1005 | 56.3% |
| 2 | DM | 434 | 24.3% |
| 3 | Localization | 230 | 12.9% |
| 4 | ML | 115 | 6.4% |
As some of you know, NLP is the job market we are focusing the most – so, it is not surprising that the major part of the postings belong to the NLP category (56.3%). The second largest category that accounts for 24.3% is DM.
The results of the job function analysis (see below) reveal two dominating categories: Researchers/Scientists (28.9 %) and Software Engineers/Developers (28.8%).
| Subcategory | Number of postings | Proportion | |
|---|---|---|---|
| 1 | Researchers/Scientists | 517 | 28.9% |
| 2 | Software Engineers/Developers | 515 | 28.8% |
| 4 | Consultants/Experts | 148 | 8.3% |
| 5 | Managers/Executives | 147 | 8.2% |
| 6 | Others | 91 | 5.1% |
| 7 | Computational Linguists | 74 | 4.1% |
| 8 | Internships | 37 | 2.1% |
| 9 | Software Testers | 24 | 1.3% |
| 10 | Product Managers | 18 | 1% |
| 11 | Consultants/experts | 3 | 0.2% |

As I said at the beginning of this article, we are living in very interesting time: the decision making process is becoming less creative and intuitive, but more performance-based. Tools, metrics, data analysis techniques allow to efficiently harness historical data to improve the quality of business-related decision. However, job seekers can also exploit these emerging opportunities appeared due to a democratization of data sources. We are always welcome to hear from you if you have any ideas of how the data we have in our database can be exploited to simplify the process of job hunting.
About the authors
 Maxim Khalilov, PhD is the R&D manager at TAUS B.V and the co-founder of NLPPeople.com. He is a former post-doctoral researcher at the University of Amsterdam, intern at Macquarie University (Australia) and a PhD student at the Polytechnic University of Catalonia (Spain).

Andrey Ziyatdinov is a full-time researcher at Hospital de Sant Pau (Barcelona) working very close to the bioinformatics data processing on a daily basis. He is currently pursuing the PhD degree in Bioengineering at the Polytechnic University of Catalonia (Spain). Andrey’s research interests include applied pattern recognition focusing chemical sensors, machine olfaction, and bioinformatics.